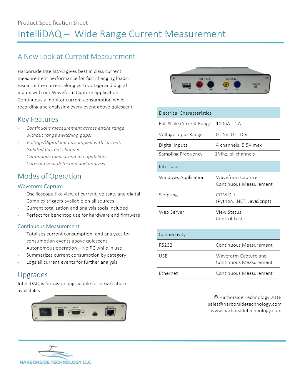
Harborside IntelliDAQ gives best in class current measurement performance for fast changing loads. Visualize the current along with voltage and digital inputs with our Waveform Capture application. Continuously monitor current consumption while recording and analyzing every event above quiescent.
IntelliDAQ


Electrical Characteristics
Full Scale Current Range: 100nA – 2A
Voltage Input Range: 0-5V, 0-10V
Digital Inputs: 4, 5.5V max
Sampling Frequency: 1MHz, all channels
Key Features
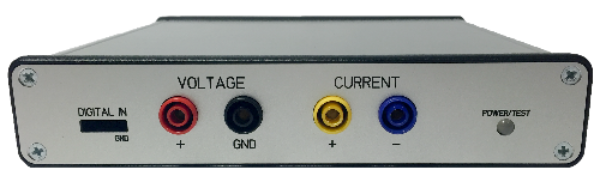
Isolated Current channel
Continuous measurement capabilities
Voltage and digital inputs sampled coincident with current.
Continuous measurement across entire range without range switching gaps.
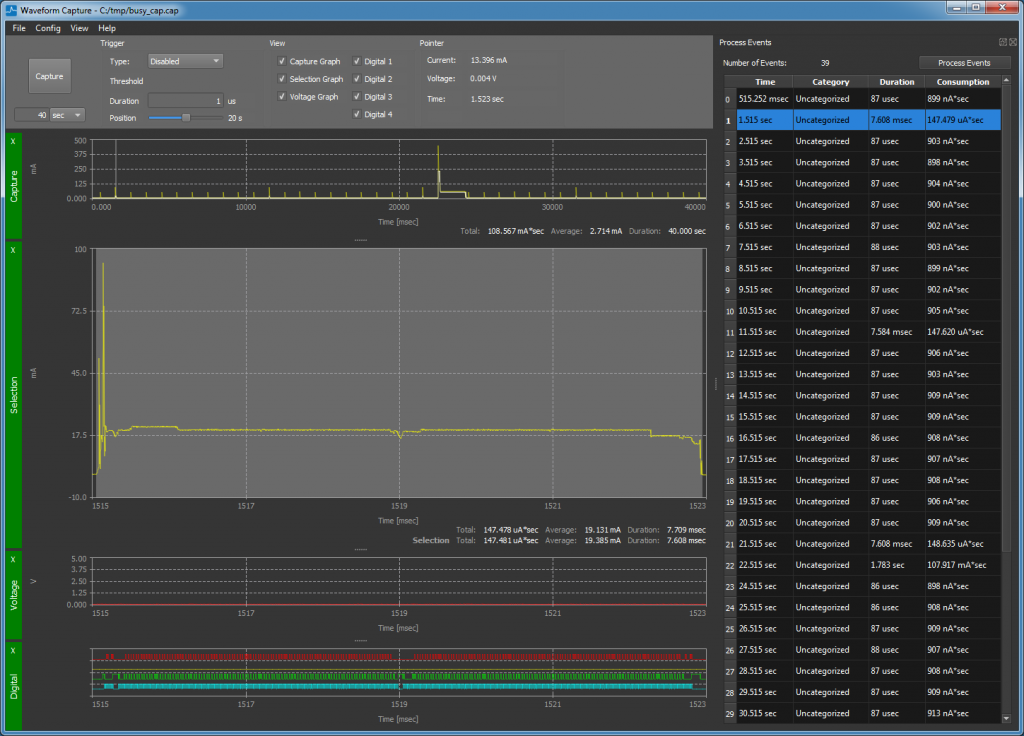
Waveform Capture
Waveform Capture is your interface to the benchtop operating mode for IntelliDAQ. It provides a highly intuitive, oscilloscope-like view of your current, voltage, and digital data. Because the focus is on current, it gives you easy access to instantaneous, and totalized current at any point and selection within your capture.
Additionally, it also provides a set of tools to analyze your capture for current events, and to generate your test configuration so that the events can be properly characterized in continuous measurement mode.
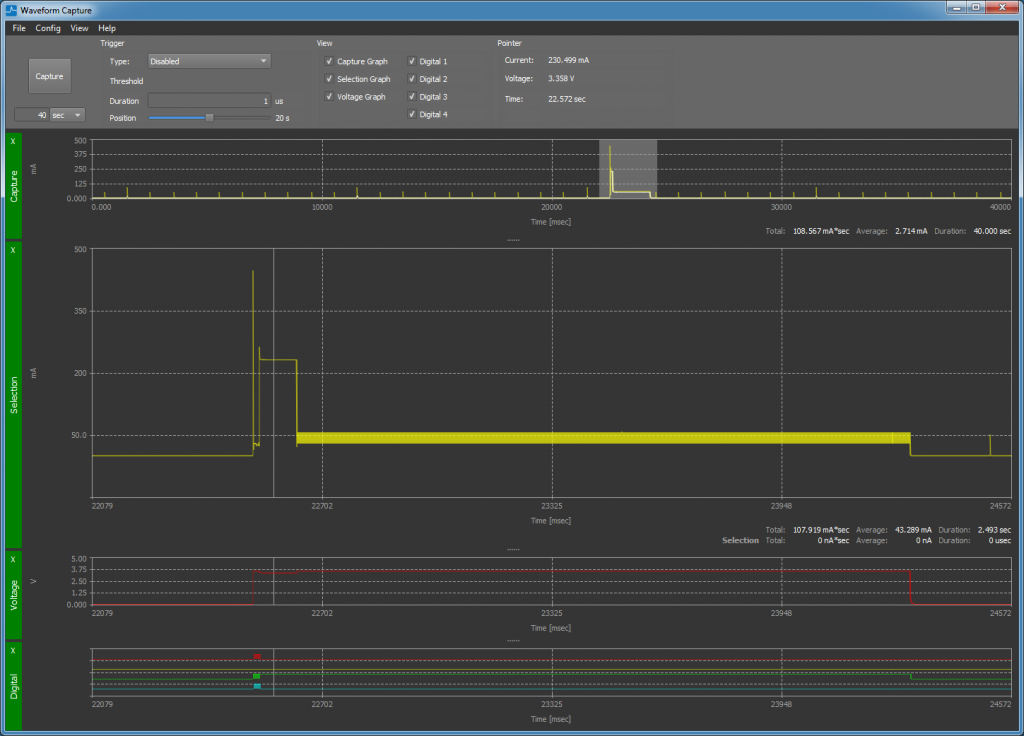
An intuitive, oscilloscope-like view gives you a great view into where your product is using energy. Flexible triggers based on current, voltage, and digital inputs allows you to capture the most stubborn events.
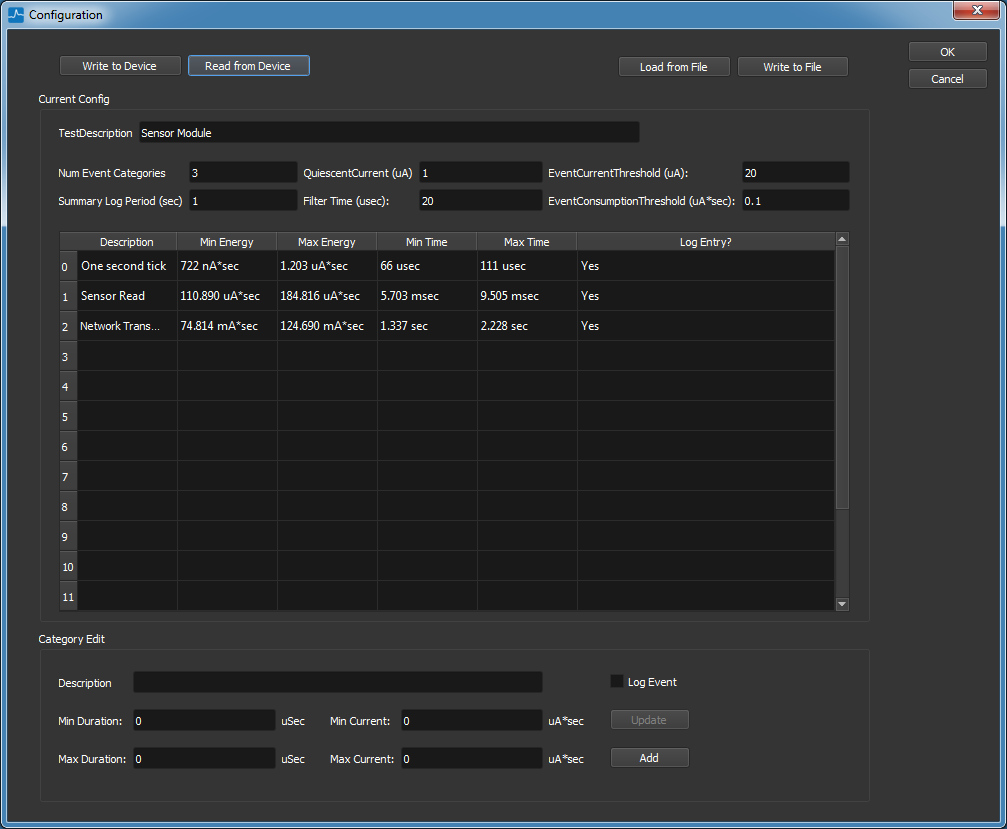
Accurate test configuration is the key to getting the most information out of continuous measurement mode. Waveform Capture gives you the tools to do this. Enter the event configuration manually, or have Waveform Capture scan your capture, and create events for you.
After configuring a few basic parameters about your test config, you can have waveform capture scan your capture and identify any events it sees. Clicking on these events displays the event in the graph. You can then add that event to the test configuration and give it a name. As you refine your configuration, you can rescan for events to see how changes to your configuration affect how the events are identified.
Continuous Capture Mode
Continuous Capture mode is where IntelliDAQ really shines. You can test your product in its normal operating environment while totalizing and analyzing all the current consumed.
View totals, and summary data for all event categories to quickly see if the product is within spec.
View totals, and summary data for all event categories to quickly see if the product is within spec.
View time, duration, current consumption, min/max current, and min/max voltage for every event to hunt down any current anomalies your product may have.
Configure periodic summary events to be logged, so that you can view how your average, quiescent, and peak currents change over time. You can also record voltage which can be used to connect to external devices like a thermocouple to correlate changes to temperature.
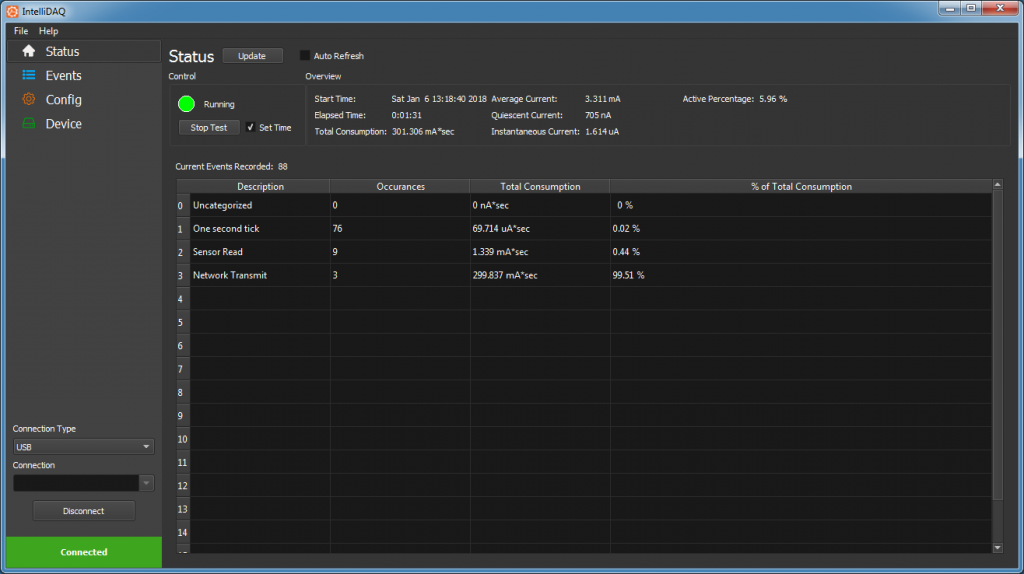
The status page gives you quick access to test totals and averages, as well as a summary of each of the event categories. This will quickly show you whether or not your product is within spec.
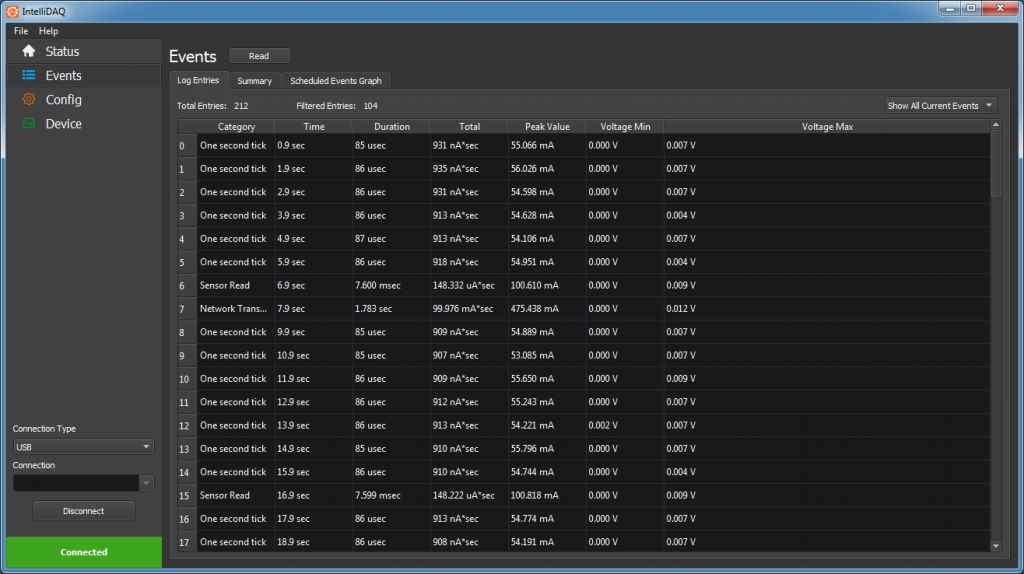
If you need more info than you can see in the status page, you can view all the events that occurred (and were configured to be logged), and all the summary events that you scheduled to log. You can filter by category and event type. A quick view of the uncategorized events will show you where your product was operating outside of your test configuration.

The summary events help you keep track of averages, peaks, and quiescent currents over time. The event graph allows you to view this graphically. This is especially helpful if you are tracking external parameters like temperature through the voltage inputs so that you can see how they affect your current measurements.
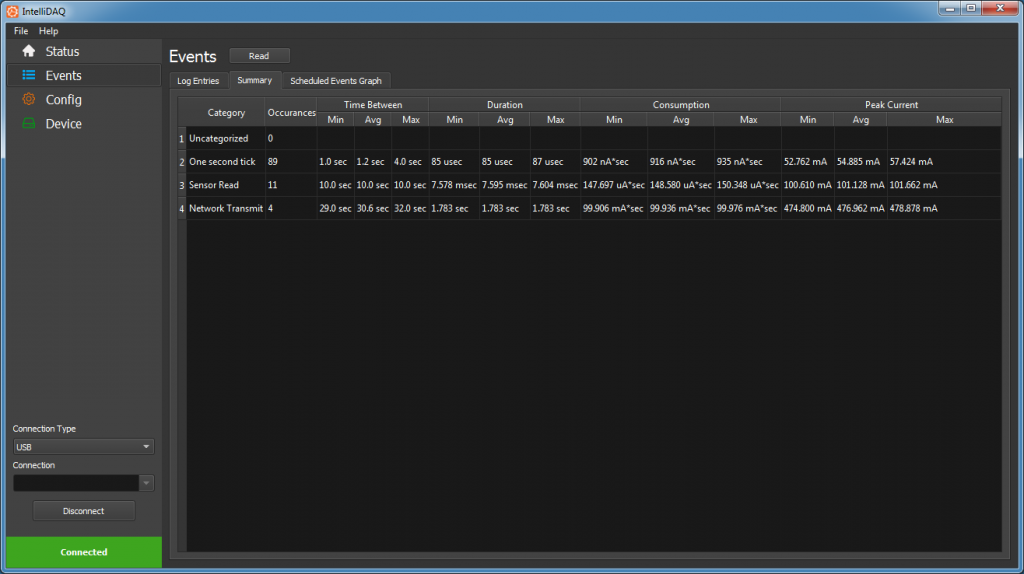
A long test can generate thousands of events, and can be difficult to review manually. The Event Summary gives you min, max, and average values for all the parameters in each event category, as well as the timing between events. This helps you determine whether your product is behaving as you would expect.
Automate your Testing
In traditional battery powered device development, the battery model is validated on the initial release, but is so onerous to do, that it is rarely done on product updates. In order to ensure quality in your products, you need to validate your current consumption on every hardware version, every firmware version, and every major config change. The only way to ensure this happens is to automate the process so that it is an integral part of your release cycle. Our automation interface gives you the same data access, and test control you have with our PC application.
Code samples for Python, C #, and Javascript
Windows COM interface, so that it can be accessed by virtually any windows development environment.
Runs identically over a local connection or through network interface.
Quickly Validate your changes with the summary data. Dig into the detailed data if your test fails.

Spec Sheet
112KB